

Adding charts, sorting, and filtering
In this guide, you'll learn how to turn your data into a chart, sort it into order, and filter it to show only the rows you need so you can spot trends and find values quickly in larger datasets. Charts, sorting, and filtering all work best with labelled columns, so work with a spreadsheet that has clear column headers. The steps start with Windows, followed by shorter sections for Mac, Android, and iOS.
Before you begin
Make sure you have:
MobiOffice installed on your device. See Installing MobiOffice on multiple devices.
A spreadsheet with data open in MobiSheets. See Creating and editing spreadsheets.
Signed in to MobiSheets. See Signing in to MobiSheets.
An internet connection, if you want to save to the cloud.
Add a chart on Windows
1. Select the range of cells you want to chart, including the column headers.
2. Click Chart in the ribbon. You can also open the Insert tab from the dropdown menu, then click Chart.
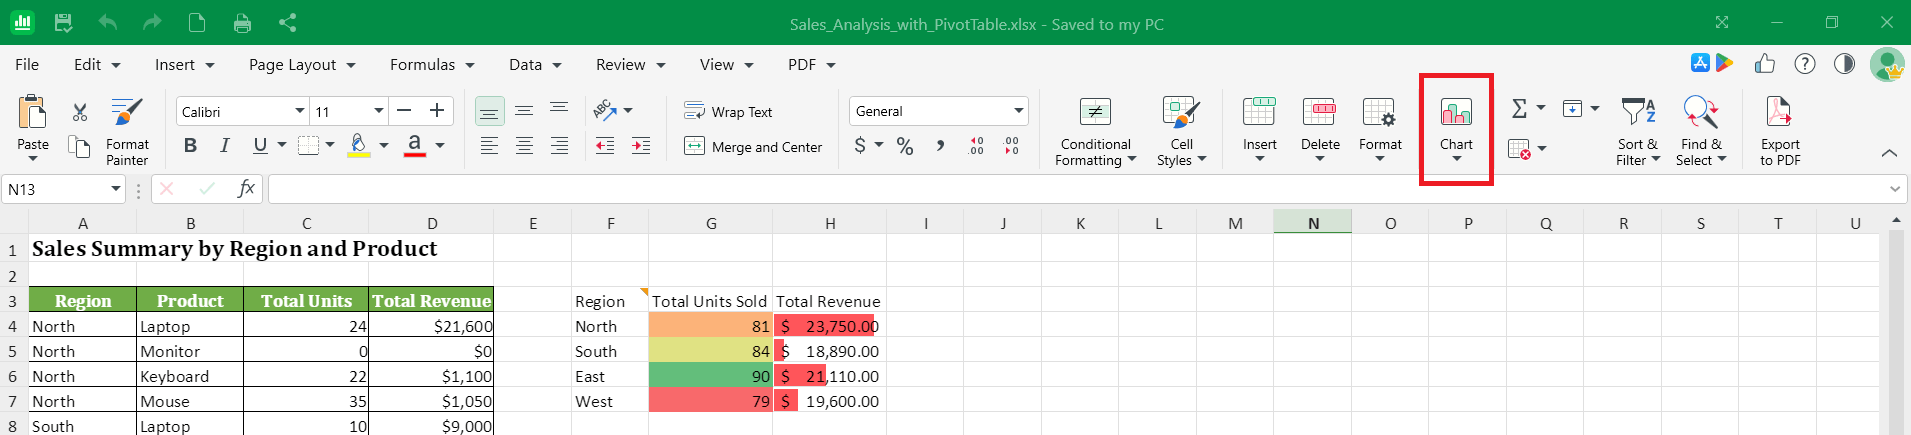
3. Choose a chart type, such as column, line, or pie.
4. Customize the chart with the available options, then resize or move it on the sheet. For more options, right-click on the chart and choose Format Chart Area on the context menu.
Tip: Pick a chart type that fits your data. Use a column or bar chart to compare values, a line chart to show change over time, and a pie chart to show parts of a whole.
Sort data
Sorting rearranges your rows based on the values in one or more columns, such as A to Z or smallest to largest.
1. Select a cell in the column you want to sort by or select the full range.
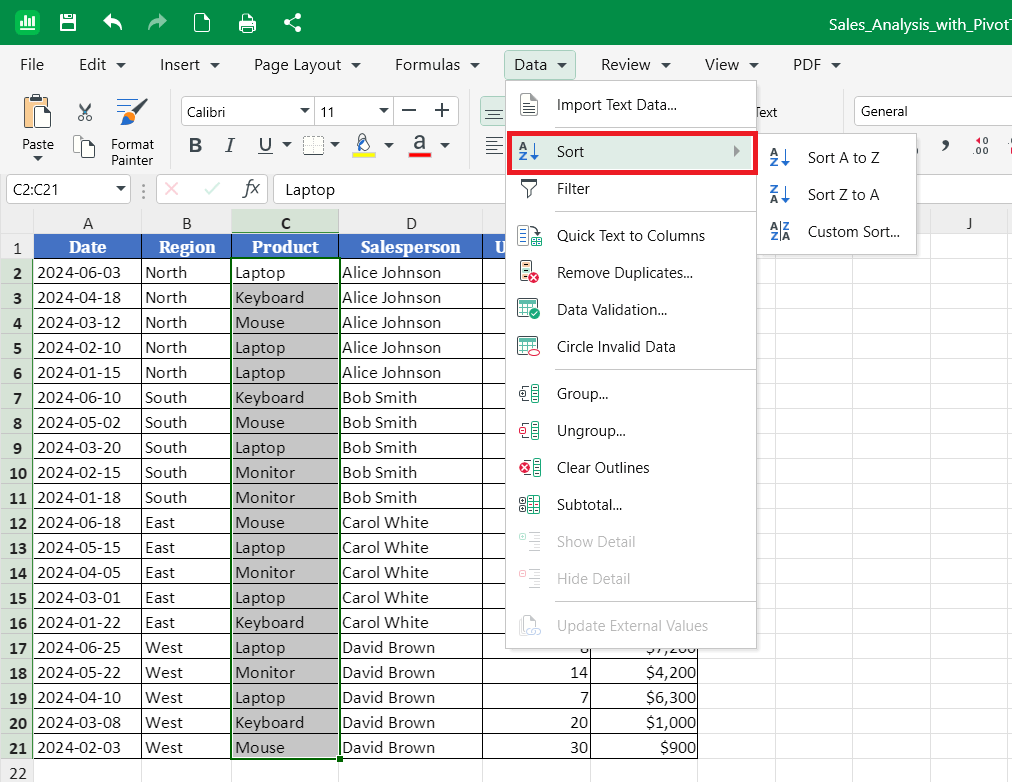
2. Open the Data tab from the dropdown menu.
3. Choose how to sort:
A to Z to sort in ascending order, or
Z to A to sort in descending order.
4. To sort by more than one column, select Custom Sort and set your conditions.
Note: Include the header row in your data so MobiSheets can sort by column name and keep your headers in place.
Filter data
Filtering hides the rows you don't need so you can focus on specific values, without deleting any data.
1. Select a cell inside your data range.
2. Click Sort & Filter in the ribbon menu. Alternatively, you can open the Data tab from the dropdown menu then click Filter.
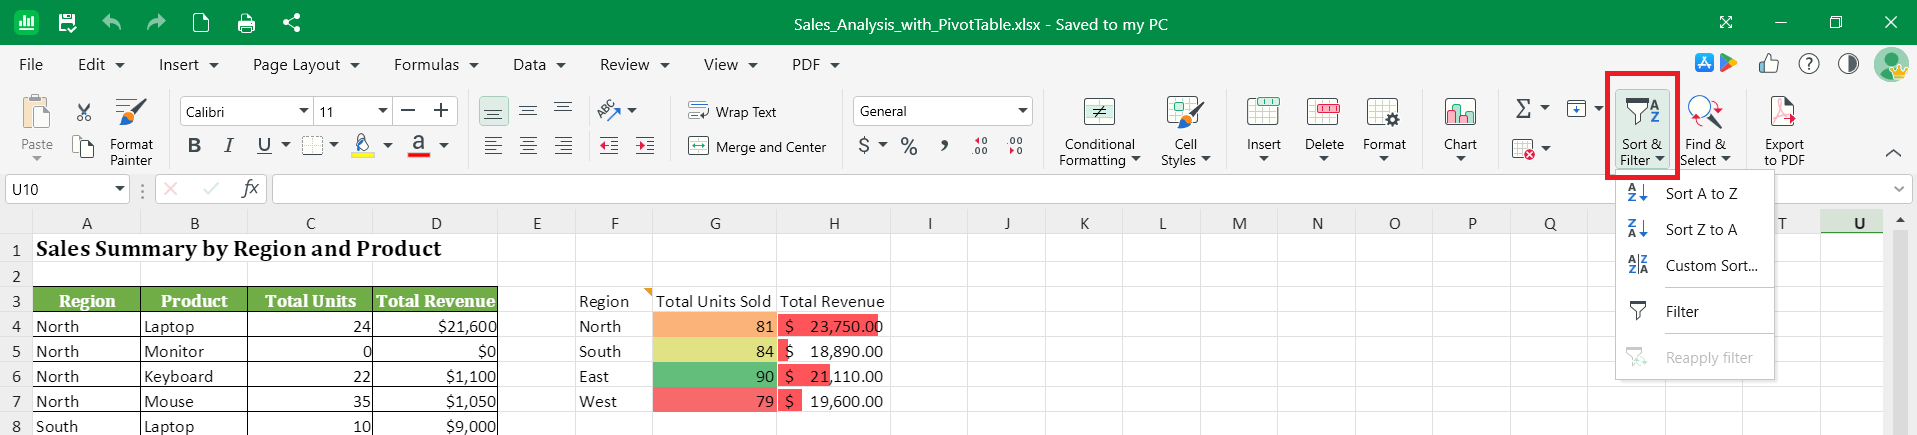
3. Small filter arrows appear in each column header.
4. Click the filter arrow on the column you want to filter.
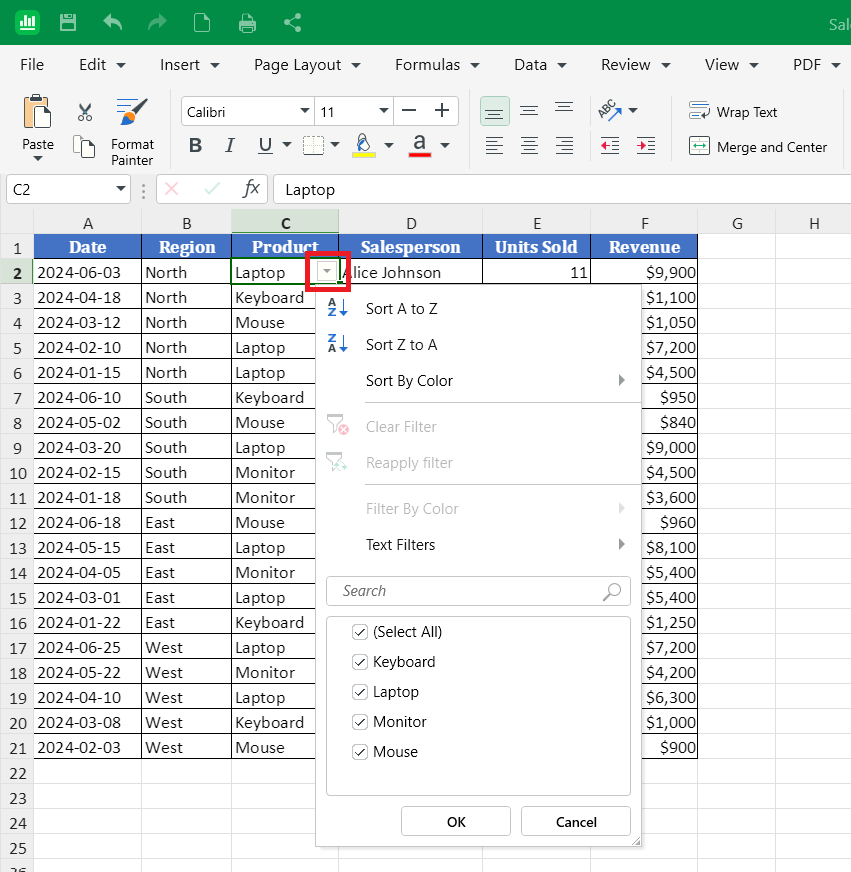
5. Choose what to show:
Check or uncheck specific values to show only the rows you want, or
Use a text filter such as Equals, Contains, or Begins with to set your own conditions.
6. Click OK.
To show all rows again, open the filter arrow and clear the filter, or click Filter on the Data tab to turn filtering off.
Charts, sorting, and filtering on Mac
1. Open your spreadsheet in MobiSheets.
2. To add a chart, select your data, open the Insert tab, and select Chart.
3. To sort or filter, select your data, open the Data tab, and choose Sort or Filter.
Charts, sorting, and filtering on Android and iOS
On phones and tablets, MobiSheets is part of the MobiOffice app.
1. Open your spreadsheet in the MobiOffice app.
2. Select the data you want to use by tapping a cell and dragging the handles.
3. To add a chart, tap Insert, then tap Chart and choose a type.
4. To sort or filter, tap Home, select Data, then choose Sort or Filter.
Troubleshooting
My chart is empty or looks wrong. Check that you selected the data range, including the headers, before inserting the chart. Make sure the cells contain numbers, not text.
Sorting mixed up my rows. Select the whole data range before sorting, not just one column, so each row stays together. Use Undo (Ctrl+Z) to reverse a sort.
My headers got sorted into the data. Include the header row in your selection so MobiSheets keeps it at the top.
Filtering hid rows I need. Filtering hides rows, it doesn't delete them. Clear the filter or turn filtering off to show all rows again.


